This is the P2PU Archive. If you want the current site, go to www.p2pu.org!
DIY Math
Re-Booting Modeling Wins in the NBA: A Work in Progress …
I – Introduction
Statistics in sports are a confusing entity. People love to know who’s winning the batting title in baseball, but is that guy really the best player? Maybe a guy with a lower batting average who walks a lot more is more valuable to his team. Statistics are great for arguing questions such as these, they give an objective recording of what players do on the field. Yet reading statistics in a productive way is more difficult than it may seem. Back in the late 1970’s, Bill James revolutionized the way statistics record games and in how they are interpreted. His work has led modern day baseball general managers, the smart ones anyway, to create their teams in an entirely different way from what was done in the past. His work has changed what people perceived to be valuable in a baseball player.
One of the advantages of baseball statistics is that baseball is a relatively straightforward game. Though two teams are playing against each other, the only direct competition is one-on-one, pitcher vs. batter. If a batter does get a hit, there is only one option of where he can run: first base, then second and so on. Given these constraints, numbers are able to model fairly well what goes on in a game. Basketball, on the other hand, is not so straightforward.
Though Kobe Bryant may disagree, it is anything but a one-on-one game. Whether on defense or offense, teams have to play together and feed off each other. Even though Kobe may be one of the best of all time, he cannot beat five defenders by himself, or defend five other players by himself. In addition, unlike the base paths, there are really no limits to what a basketball player can do with the ball in his hand. He could go right, left, shoot, post up, or pass, or a million things.
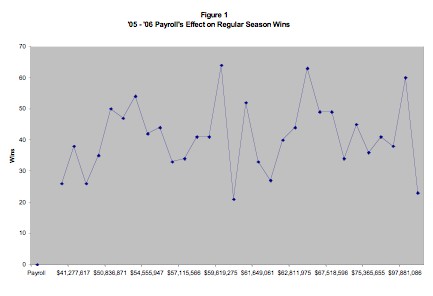
These two factors: the complimentary nature of the game and the nearly limitless individual options, make it very difficult to capture numerically. Inspired by Bill James, some people have attempted to create statistics which accurately model an NBA player. Obviously, points per game are not a good method of evaluation. It does not take into account, the great point guard who set up all the players’ shots, or the poor defender who played against him that night. Progress has been made by individuals, but there is still a long way to go. This is where I fit in. My goal is to add to the established literature, and create a model for the determinants of success in the NBA. Within this paper I will try to recreate a team statistically to see what parts of it are important for winning games. I don’t know if I will change how general managers do their jobs, but given that payroll has absolutely no effect on regular season or playoff wins, they could certainly use some help (see graph 1).
Graph 1
Payroll vs Regular Season Wins in the NBA
II – Data
All of my data was gathered from www.basketball-reference.com. I am using regular season statistics, because they give a larger sample size than playoff statistics. Success in the regular season is necessary, up to a point, for success in the playoffs. Unless a team wins enough games to finish among the top eight in its conference, they will miss any chance to win a title. Traditionally only one the top seeds who advance all the way to the Finals. Having home court advantage is a huge edge in a seven game series. Thus, regular season success is important to try and model, because without it, playoff success is impossible.
The period I am examining is from the 1999-2000 season up until the 2006-07 season. The early year is the year following the lockout, when the landscape of the NBA changed. Surveying this period is designed to give me a comprehensive understanding of the modern era of basketball. How the game is played in the NBA changes roughly every decade. Conventional basketball wisdom says you need a great center to win a championship. Michael Jordan’s dynasty proved that was far from true. The game now is different, even from when Jordan last won a title. Look no further than Golden State’s recent upset of Dallas, to see that new ideas are having success. My model will be an attempt to understand what wins in the NBA today.
III – Method
Dependant Variable
y = wins
The dependant variable of my model will be fairly straightforward: regular season wins. At the end of an NBA season they are the only thing that matters. Not how many points a team scores, or how well they played defensively, just how many games they won.
While this point may seem obvious and unnecessary to hammer home, most, if not all, of modern NBA statistics fail to grasp this concept. The NBA.com efficiency stat merely adds up all the different stats recording what a player does. This sum is supposed to say something helpful, but it’s worthless. Many others stats attempt to capture what individual players do on the floor during a game. Unfortunately, they only seek to capture numerically what he actually does, not if what he does leads to victories. Jamal Crawford scoring 30 or 40, points in a game is great. It may be tough for his team to win; however, if he does it shooting 12 for 30. Nevertheless, his average points per game will improve and improve his seasonal average. This is great for Crawford, but a problem for his team, because despite all his scoring they would be likely to lose the game if he missed that many shots. Thus the only criteria I want to evaluate are if what the players do on the floor as a team leads to victories. Whether or not an individual had a great game or even a great season, as Kevin Garnett can attest, it does not matter if he cannot work with his teammates to win more games than they lose.
Dependant Variables x = team defense + point guard + shooting guard + small forward + power forward +center + bench guard + bench forward + bench center
My model will be an attempt to accurately model what a team does during an NBA game, and if their collective efforts lead to victories. I will attempt to re-create each of a team’s five starters statistically, as well as their top three bench players. Originally I considered trying to model entire benches of teams. Not only would it be very time consuming, it would not fit with basketball theory. In general, no matter how many guys a coach plays, wins depend upon that top eight. If there are not enough quality players in that group, it will not matter who the bottom four guys are; the team will stink.
To accomplish this re-creation, I use a combination of those individual player statistics I vilified in the previous section model. Working individual statistics together, allows me to capture a point guard’s contribution to success. More at least, than assist to turnover ratio, which is where analysts typically go for evidence of the top passers in the league.
Modeling the contributions of a team’s top eight will, hopefully, shed light on what contributions from where lead collectively to success. In the process, I make certain assumptions about what each position does, or should be doing, during a game. My model is my idea of what an ideal team should be. Before I go into describing the positions, I need to clear up a couple points. In these measures, free throws have been taken into account for the 1,2 and 3 positions in individual average points per forty minutes. Secondly, I have weighted individual statistics differently, depending on which aspects of a position I think are the most important. Finally, looking at the regression results if a variable starts with “wt_” then it is weighted. If that is not there, then it has not been weighted differently.
Team Defense
- 1 * Opponents Shooting %
- 1 * Opponents Turnovers
- 1 * Team Blocks
These three statistics are meant to measure the team aspect of defense. Defense is very difficult to measure statistically because of its complementary nature. Complementarity needs to be controlled for on offense as well, but on offense there are numerous individual statistics to do that with. Defense statistics have not developed that far yet, and as such I will be evaluating it from team to team.
Point Guard
- .75 * Points per 40
-
1.5 * Assist Ratio
- Assist Ratio (available since the 1977-78 season in the NBA); the formula is 100*(AST / (FGA + 0.44*FTA + AST + TO)). Assist ratio is an estimate of assists per 100 possessions.
- 1 * Team FG%
The point guard in this model will be more of a traditional pass-first point guard, than say, a Stephan Marbury type point guard. I will try to focus on their passing abilities to see how well they help their teammates score. I included assist ratio, which is more precise than simply assist to turnover ratio. Great pass-first point guards will have high values for this statistic. I also included the overall team field goal percentage. A good point guard should make his teammates better. While this is very difficult to model statistically, it should be captured in the overall points a team scores. Teams with better point guards should score more. I include points per forty minutes, because in order to be effective, they do also have to be a threat to score themselves. Otherwise, defenses will lay off them and use another man to cover the point guard’s four teammates. This will make it harder for the point guard to put them in easy positions to capitalize. Points per forty minutes are used instead of points per game to control for the different average minutes of each player I am trying to measure.
Shooting Guard
- 1.5 * Points per 40
-
1.5 * eFG%
- Effective field goal percentage; the formula is (FG + 0.5*3P) / FGA. This statistic adjusts for the fact that a 3-point field goal is worth one more point than a 2-point field goal. For example, suppose Player A goes 4 for 10 with 2 threes, while Player B goes 5 for 10 with 0 threes. Each player would have 10 points from field goals, and thus would have the same effective field goal percentage (50%).
-
.75 * Usage or Team Scoring
- Usage rate (available since the 1977-78 season in NBA); the formula is 40 * (Lg Pace / Tm Pace) * ((FGA + 0.44*FTA + 0.33*AST + TO) / MP). Usage rate estimates the number of possessions a player uses per 40 minutes played.
The shooting guard on this team’s primary role is to score from the backcourt. As such I have weighted his average points per forty minutes higher than the point guard. In addition I will model him using eFG%, which is similar to FG%, but takes into account the 50% extra value from a 3-pointer. Shooting well from the three point line, while it is not essential to success, is important. Good three point shooting not only puts points on the board quicker, it opens things up for the post players. If defenses have to defend all the way out to the three point line, they cannot cluster all their players in the post. Usage was included, because better scorers control the ball more and use more possessions in a game. It is more efficient for a successful team to do it this way, because it does not make any sense to have less talented players taking more shots than your best scorer.
Small Forward
- .75 * Points per 40
- 1 * eFG%
-
1 * Reb-Rate
- Rebound rate (available since the 1970-71 season in NBA); the formula is (TRB * (Tm MP / 5)) / (MP * (Tm TRB + Opp TRB)), multiplied by 100. Rebound rate is an estimate of the percentage of missed shots a player rebounded while he was on the floor.
The small forward is the glue guy. He has to have some of the skills of a guard, as well as those of a post player: specifically, good shooting as well as rebounding skills. I have created a kind of mix of backcourt and frontcourt statistics to model the 3. Scoring was weighed less, because that is not his primary role. I included eFG% again to measure his ability to hit 3-pointers. Finally I included Rebound rate (RR) instead of rebounds per game, because RR is a more precise measure of a good rebounder.
Power Forward
- 1.5 * Points Per 40
-
1.5 * TS%
- True shooting percentage; the formula is PTS / (2*(FGA + (0.44*FTA)).
- 1.25 * Reb-Rate
The power forward is the primary frontcourt scorer, especially over the recent period I am surveying. The era of the great center has come and gone. Examples of this are: Tim Duncan, Kevin Garnett, Dirk Nowitzki, Jermaine O’Neal, Rasheed Wallace and so on. All of them are dominant power forwards. The great centers of today are really limited to Shaq and Yao. Even a great center like Amare Stoudamire is really more of a power forward. Points are weighted heavily here as well as rebounds. I used TS% instead of eFG%, because it is not necessary to account for three point field goals amongst power forwards.
Center
- 1 * POINTS PER 40
- 1.5 * Reb-Rate
- .75 * Blocks per 40
The center is measured similarly to the power forward, save that average blocks per 40 minutes are included. I struggled to come up with a way to differentiate the 4 and the 5, and bringing in blocks was the best way to do it.
Bench Guard
- 1 * POINTS PER 40
- 1.25 * eFG%
- 1 * Assist Ratio
The bench guard is meant to be a composite of the 1 and 2 positions. Examples of this in today’s NBA include the 2006-07 sixth man of the year, Leandro Barbosa.
Bench Forward
- 1 * POINTS PER 40
- 1 * Reb-Rate
- 1.25 * TS%
This guy is a composite version of the 3 and the 4. A good example of this type of player is another Phoenix Sun, Boris Diaw. Al Harrington of the Warriors, though he is no longer a bench player, filled this role for a big portion of his career.
Bench Center
- 1 * POINTS PER 40
- 1.25 * Reb-Rate
- .75 * Blocks
Light version of a starting center. On many teams this guy may be closer to a power forward, while the Bench Forward may be closer to a 3 than a 4.
IV – Results
Currently, my model is not ready to be tested, because the data is still in the process of being collected. I created an initial version of the model in SAS, and ran it with the data I have, anyway. Nothing can be learned from the coefficients, because I do not have a large enough sample size.
There are many things I need to fix with my model. For one thing, I need to recode the field goal percentage variables so that their results are easier to understand. In addition, I would like to play around with the weights. I choose these based on my ideas about what works in basketball. Playing with them within the model would probably change some of them for the better. I also need to figure out what is wrong with my bench center blocks variable. My re-created center also could use a different definition, possibly. I need also to decide what I am going to do with players who were traded midseason: should I put them on the team they finished the season with, or where they played the most games? Finally, I would prefer to run the model using data from the past thirty years or more, as opposed to just what I have called the modern era. I could still separate them out by era, but more data would lead to more robust results.
As an experiment, I tried running the model just using opponents field goal percentage, opponents turnovers, team blocks, team field goal percentage and bench center rebound rate. Using wins as a dependant variable, opponents and team field goal percentage were both significant at the 1% level, while opponents turnovers was significant at the 5% level. Though no conclusions can be drawn from these results, they are interesting to consider. Shooting well and not turning the ball over seem to be important to winning. Any basketball fan could tell you that, but this is the early stages of statistical proof.
V – Conclusion
Even though I have not finished my own model fully, I have uncovered new directions that future research could pursue. For one thing, using playoff wins as the dependant variable would be interesting. After all, winning a title is the reason teams play games at all. This dependant variable may highlight different aspects of a team necessary for playoff success, than those for regular season success.
In addition, I would like a way to have my statistical team adjust to the actual team it is trying to recreate. As opposed to saying this is what a point guard should do, I would prefer having the model respond with 3-4 stats corresponding to what an actual point guard does well or not. For an example of this limitation in my current model, Shawn Marion is one of the NBA’s best players, but the way I model the three marginalizes his contributions. Similarly, the fact Rasheed Wallace can shoot threes is not captured anywhere in my model.
Overall though, I think if I finish even just the model I have, it will be helpful. The only thing that matters in basketball is wins. Say what you want about how good a team is, unless they win more than they lose and win the championship too, they are not an all-time great team. There is also a possibility nothing could be learned from my model. That’s fine. I feel like Dee Brown or Gerald Green (to a degree, its an analogy … obviously I cannot dunk and probably never will) gliding blind through the air. I don’t know where this will lead, but I am confident and the process itself is fun and worth the effort. Work such as this may one day change how teams are created and then how the game itself is actually played. To use a lame and tired cliché, that would be a slam dunk.
Ideas for the Next Step
- The weights for different positions are just sort of randomly chosen. They are not based on anything but my own ideas of what works in basketball. This should change.
- Re-adjusting the model so it does not just arbitrarily pick the top eight players from a team, but does so based on who played the most minutes for them. This would make it easier to measure and not force teams to fit into my cookie cutter ideas of what is a good NBA team.
- Make my tone more formal. (from Jay Mandle)
- Change the y-variable to playoff wins. (from Jay Mandle)
Notes
-
This document is re-booting
-
Danoff, C.J. (2007). Modeling wins in the nba: A work in progress …. Unpublished typescript.
- I would like to thank Professor Jay Mandle for help with that, and this study.
-
Danoff, C.J. (2007). Modeling wins in the nba: A work in progress …. Unpublished typescript.
- The original version of this document can be found on Le Dive.
